Bryant Labs
Solar Radio Activity
![]()
![]() Overview
Overview
For some time, I have wanted to build a system that would allow simultaneous measurement of multiple parameters related to solar activity. Like many nerds, I also love blinking lights. So, I sketched out a somewhat modular system that would consist of up to eight input modules with amplifiers, filters, and bar-graph displays feeding into a 12-bit, 8 channel A/D converter. The bar-graphs would allow me to have a quick overview of the activity on all of the input channels. Here's a block diagram:
The input modules do some signal processing as well as housing the bar-graph driver and LEDs. Pots allow me to adjust out any offset, and also to set the bar-graph and A/D full scale voltages. Click here to see a module schematic
And, here's a picture of a completed module:
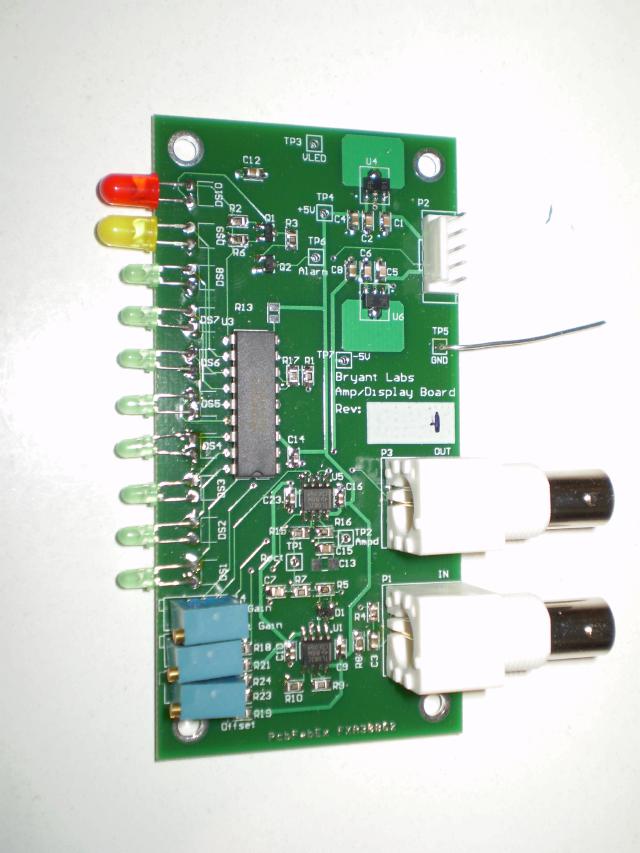
In the lower left of the schematic, you can see the on-board voltage regulators that provide +-5V DC for the analog circuitry. The audio signal from a receiver comes in on P1. U1 and D1 and the other parts around them are a precision rectifier circuit. That is followed by U5B, which gives a gain of 10 and a choice (depending on part stuffing) of integration times. Pot R22 allows me to null out any remaining offsets from the op-amps.
R20 sets the gain for the signal going to the A/D converter on the core module via buffer U5. R14 sets the signal level going to the bar-graph driver, U3. The LM391x family from National Semiconductor come in three basic flavors. The LM3914 is linear, the LM3915 has a log scale, and the LM3916 has a VU scale. Since I'm dealing with wide dynamic range signals, I'm using the LM3915 log scale here.
Some of the channels will get different parts stuffed for more gain or different filtering. At least one of them might get a linear scale bar-graph driver, but I haven't decided yet.
The Core Module provides all of the support circuitry for the modules. In the lower left corner there's the analog supplies for the modules. 18VCT from a chassis mounted transformer is rectified, filtered, and pre-regulated to +-8 volts. There's also 5VDC from a small switching supply to power the LEDs. On the left side of the schematic are the headers, one for each module, supplying the three voltages. Just to the right of those are the 8 RCA jacks carrying the signal to be digitized.
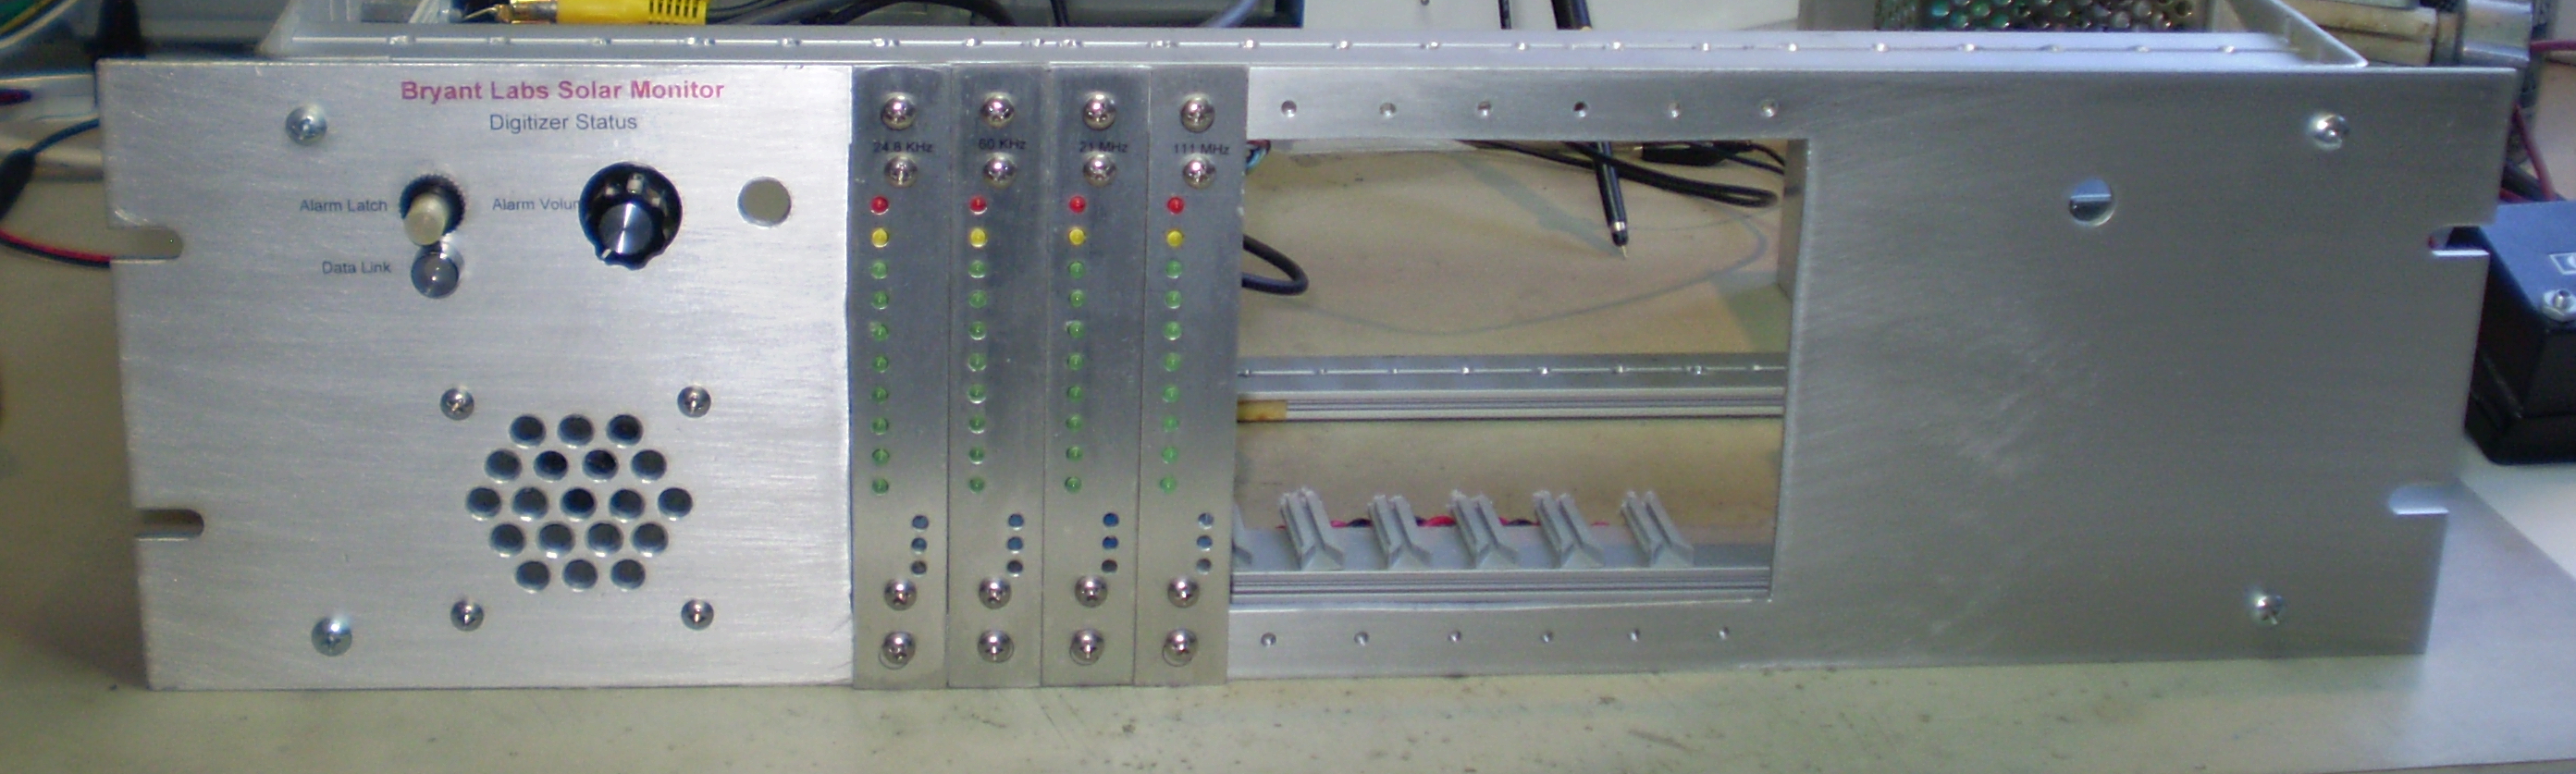
Analog to Digital conversion is handles by MAX186 A/D converter. This is controlled by an SPI type of bus through the parallel port of the data acquisition computer. The interface is monitored for activity. If more than a second goes by without an A/D access, an LED switches from green to red.
There is also an open collector alarm bus. If the red LED on any of the modules turns on, a transistor on that module pulls the alarm signal low. This causes a momentary beep, and there is also a latch with a front panel LED and button to clear it.
I designed this box to be compatible with Radio-SkyPipe. This is a great program, and the pro version will handle 8 channels. It has features to automatically generate the plots on this site.
The first two channels are monitoring VLF signals to record disturbances in the Ionosphere. This is done by measuring the received signal strength of various VLF transmitters throughout the day. Channel one is tuned to NLK in Jim Creek, Washington on 24.8 KHz. I am currently using a home built modified Gyrator II receiver, fed by a "Monopole" antenna - basically a piece of 3/4" Copper water pipe mounted vertically. This is connected to the input of a high impedance buffer amplifier. The pipe acts like a capacitive probe, picking up the electric field.
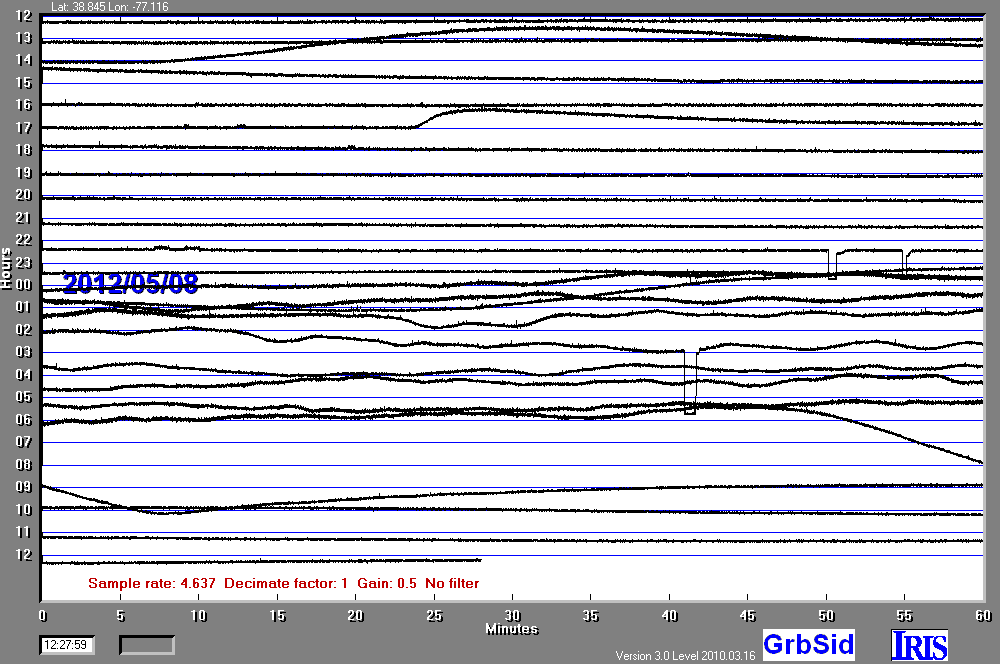
Every day that the transmitter is active, I get a distinctive pattern, with a dip in the signal strength at dusk and at dawn. This is the main reason that I choose to monitor a station almost due north of me. As the sunrise or sunset terminator sweeps across the earth, the effect on the radio path will be most dramatic if the path is North/South, since the terminator goes through the whole path very quickly. If the transmitter were East of me, the terminator could take hours to traverse the path.
The second channel is monitoring WWVB on 60.00 KHz. This signal is coming from a TrueTime 60-DC timing receiver. I re-purposed one of its rear panel BNC connectors to bring out a signal proportional to signal strength. This receiver is using a ferrite loop antenna mounted up in the rafters of the garage.
The third channel is connected to a Radio Jove type of receiver tuned in the neighborhood of 20.1MHz. This receiver is connected to a Terminated Folded Dipole antenna up on the roof. More about this later.
![]() Data Collection
Data Collection
I'm just beginning to get data from this system. I have Radio-SkyPipe set up to put the last 5 minutes of data plus the entire day (since local midnight)up on this site. You can see the latest plots here
An important part of any monitoring program like this is to have good time references for the data collected. I have a very nice High Precision Time and Frequency Reference System for my lab.
![]()
Here are some links to other on-line solar monitoring sites:
![]()
Last Revised: 23-May-2010